If you are a little bit interested by digital marketing, you have probably heard of AB testing. This concept allows you to test variations on a webpage to discover which one converts better. The idea is then to run experiment after experiment to improve your conversion rate. Several amazing tools allow you to do that with very few clicks and without headaches. For instance, you can give a look at Visual Website Optimizer, Optimizely or Convert. However, except VWO which is the cheapest with a $49/mo starting plan, most of these tools are not affordable (several thousand dollars per month).
Google Analytics offer a free, but cumbersome alternative. This post is the occasion for me to keep a step by step tutorial on how to get up and running with Google Experiments, the AB testing feature of Google Analytics. I will assume in the following of this post that you are already familiar with Google Analytics (at least you know what this tool does and that you already use it to record your website performance).
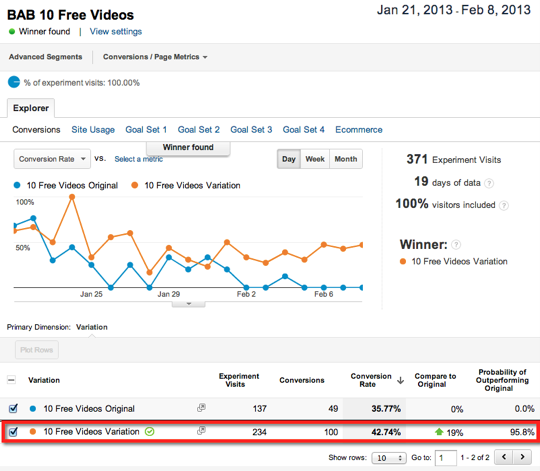
Google Experiment – Example from becomeablogger.com
In a near future, Google is going to release Optimize, a similar tool which will work on top of Google Tag Manager. As the tool is not yet available, we will only explain how to work with Google Experiments at the moment. If you want to use GTM, some links are available in the conclusion.
Before you begin
Before you begin reading this tutorial, you have to know that AB splitting in Google Experiments can work in two different ways.
URL Split testing
The first one is by defining 2 distinct pages by giving distinct URLs to the tool. The experiment will then redirect each visitor on a specific page.
So you need to have two different variations accessible on your server, say www.example.org/page1.html and www.example.org/page2.html. When configuring GA Experiments, it will be easy to get up and running with this test. However, you will need to design a couple of such pages every time you want to run an experiment. After 2 or 3 experiments, you will see how painful the management of such temporary pages can get.
In addition, this could hurt your SEO if you keep duplicate pages publicly accessible. Don’t forget to set a rel=canonical if you use this method.
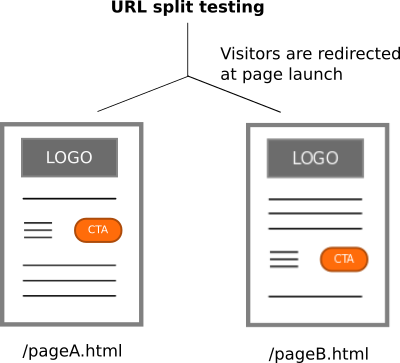
The tool will redirect to one of the available URLs
Javascript dynamic testing (called client-side)
The second way is by using javascript directly in your pages. GA Experiments will decide for you if the visitor should see variation 1 or variation 2 and it will set a JS variable to you can retrieve. Then it’s up to you to display the correct elements to the visitors based on this variable. This method, despite requiring getting your hands dirty is more manageable on the long term.
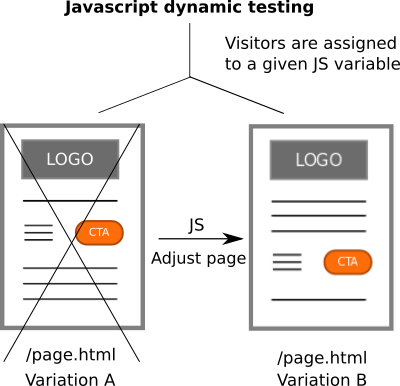
The tool will set a JS variable for each visitor.
The page then should adjust in function of the variable
If you work with the javascript code, you can for instance reuse a previous variation. Why is it interesting ? Well, you will see later than one should never test two things at the same time on a page. So, you cannot test A/B and C/D at the same time. But what you can do is testing several things one after the others, in scenarios.
Example : If you know that B won over A, you will use variation B in the future. Now, you will test C over D, while using the variation B (let’s write this as (C|B) and (D|B) as it’s usually expressed in statistics). Suppose that (C|B) brought an increase of +20% on your signups. If you are really curious, you might now want to try (C|B) over (D|A). This is something you will easily do with the javascript, but not with the redirection.
Another argument for the client-side version : since the visitor variation is saved by google, s/he will always be looking at the same variation. This allows you to A/B test multi-pages scenarios. So if you need to change the order in your onboarding experience, and see how it impacts your visitors, this is possible.
So, we will focus here on the javascript version (the other one being really easier to implement). The official documentation is available here.
Step 1 : Designing an experiment
An experiment is a testable hypothesis. You need an assumption such as : “If I my heading font is 24pt instead of 18pt, people might be more likely to signup“. Then, you need to test it : testing means that you can collect data and compare the results. For instance, in the previous example, the data collected will be the amount of people who sign up (well, actually, you will also need to know how many people visited your page, so it’s a ratio).
If you cannot collect data and cannot compare your assumption versus the original version, your experiment will not be worth anything. Suppose that you assume that turning your logo from blue to yellow will increase visitors conversion on rainy days. Well, practically, this is not something you will be able to measure (easily).
To know what you could change, make educated guesses. Try to copy competitors, use your knowledge of famous websites. For instance, at Elokenz, our dream company and main source of inspiration is Buffer (unfortunately, it turns out that by getting inspired we also became a competitor). Whenever we wonder how to improve things on our tool, we ask ourselves : how did Buffer decide to solve the problem ? Big companies have had more time and ressources than you will ever have to experiment and draw conclusions. So get inspired.
So, write down :
- the changes you will bring to your page (based on the hypothesis)
- where and how you will collect data (based on the effect it should have)
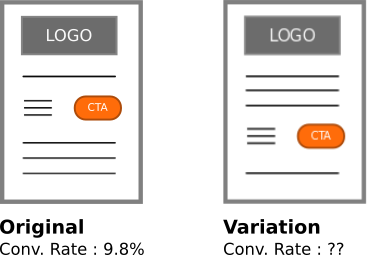
To be a bit more practical here, in the context of this post, we will assume that you want to track the conversion ratio of a form and that you want to see the effect if you change the order of your sections.
A word of caution here : never, never, never run more than one experiment at a time on a given page (except if you are a data-analyst and know what you’re doing). You can run tests in parallel on two distinct page (example : CTA on Home and CTA on Pricing). But don’t try to optimize two things at the same time (example : signup on Home and CTA on Home).
Step 2 : Tracking your goal in Google Analytics
Here I assume that you already have a working Analytics tracking on your website. I will quickly explain here how to setup a business goal in Google Analytics (GA). If you have some troubles in this section, a quick search will help you to get started since hundreds of articles are covering this topic, for instance, Paul Koks wrote a step-by-step guide to Google Analytics Goals.
The first thing you need to do, is to get to the Admin section of your account. As GA interface is going to change pretty soon after I publish this post, I added two screenshots to show you where you will find it : in the classical UI, it sits in an horizontal top menu, in the new UI it sits at the bottom of the left sidebar.
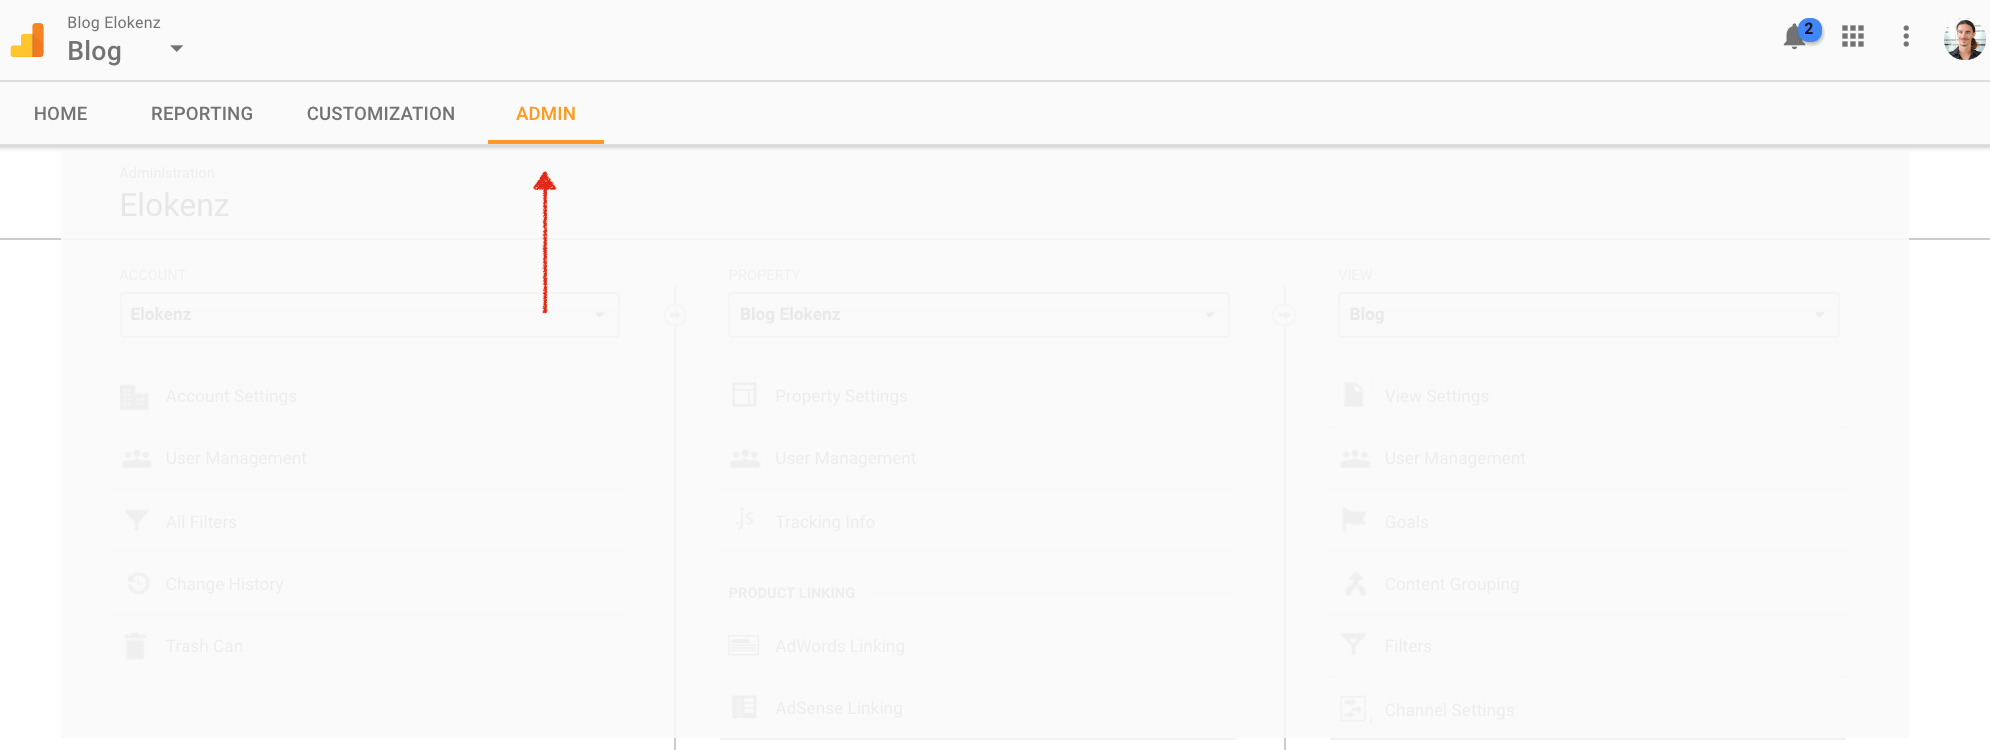
The current Google Analytics Interface – Link to Admin
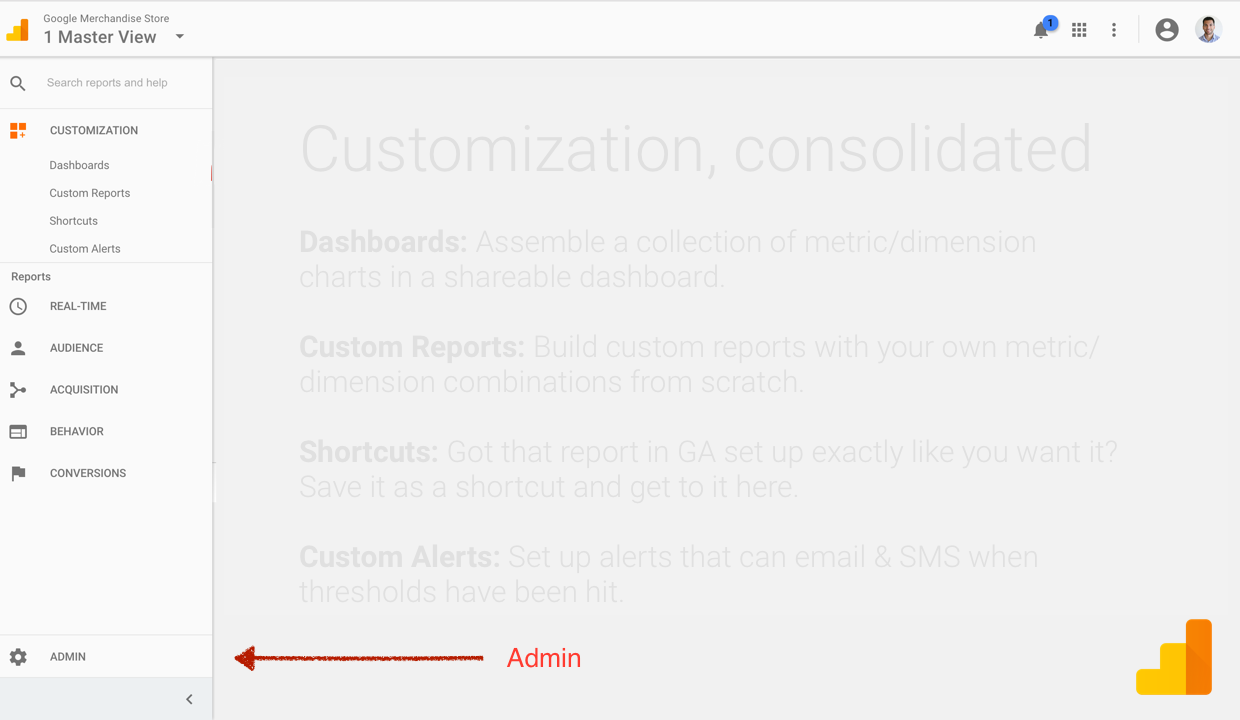
The new Google Analytics Interface – Link to Admin
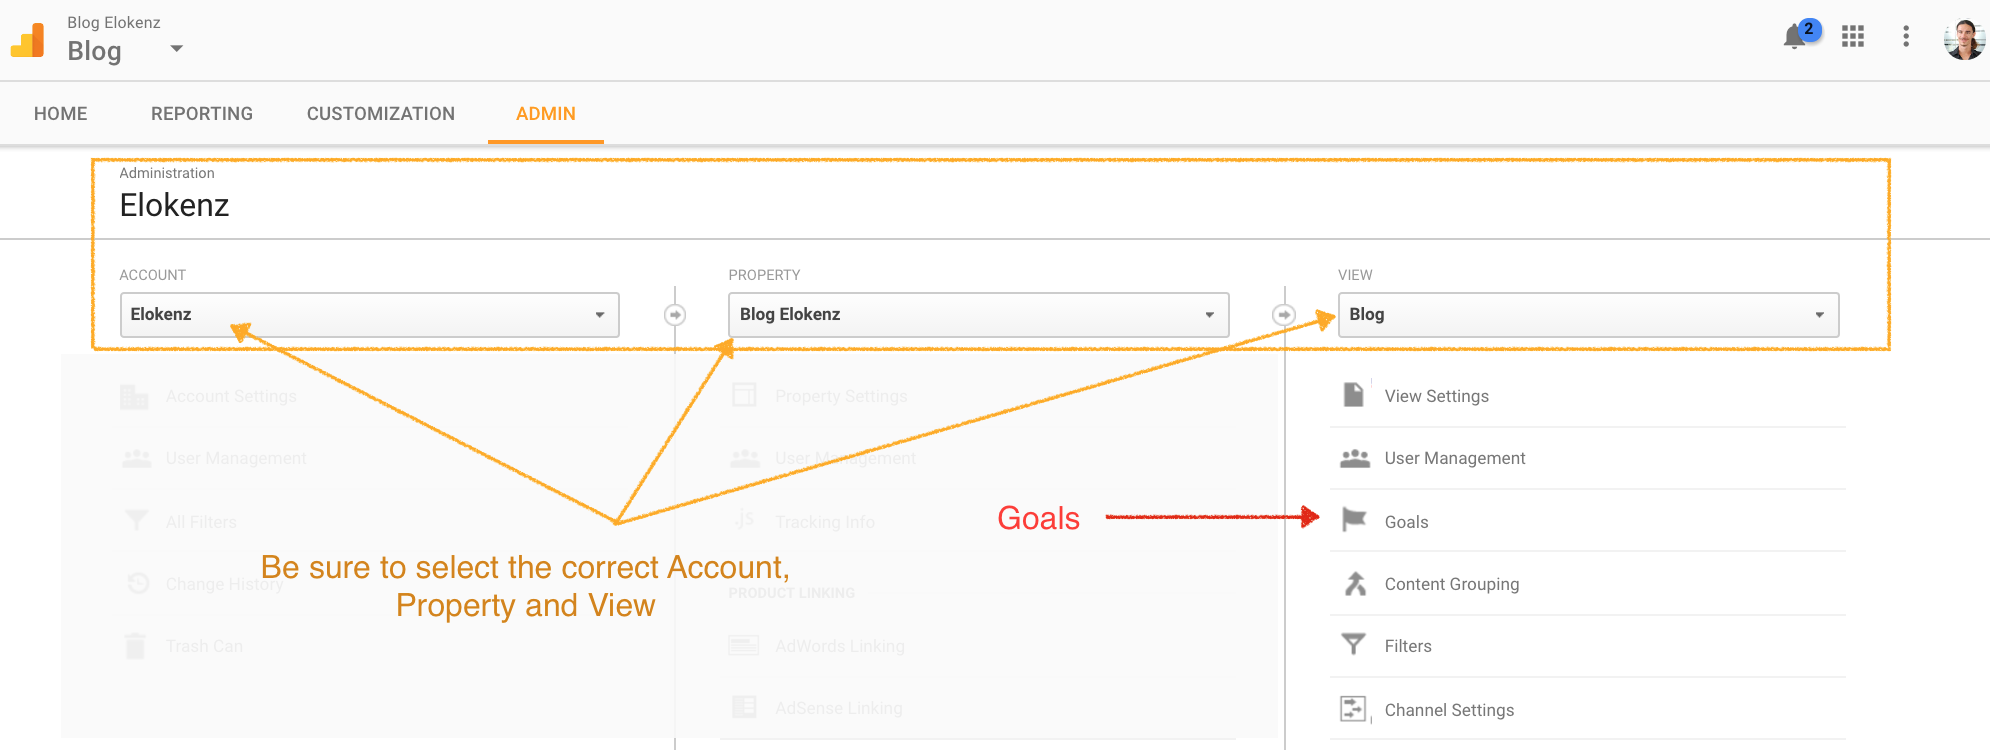
Once you are in the admin you need to head over the “Goals” link, in the View section. If you have several websites listed on GA, be sure to be working on the correct Account, Property and View, otherwise you will define goals for another website.
From the goal page, you need to setup your goal by entering a Name (try to pick one that you will easily remember, believe me this is important), and a Type. Depending on the goal you have decided to track, the type may vary. However, in the beginning you will likely use “Destination” and give an Url as the goal’s target. If you have more experience with GA, you will probably have Events defined somewhere (either from your website or from an external system like Google Tag Manager).
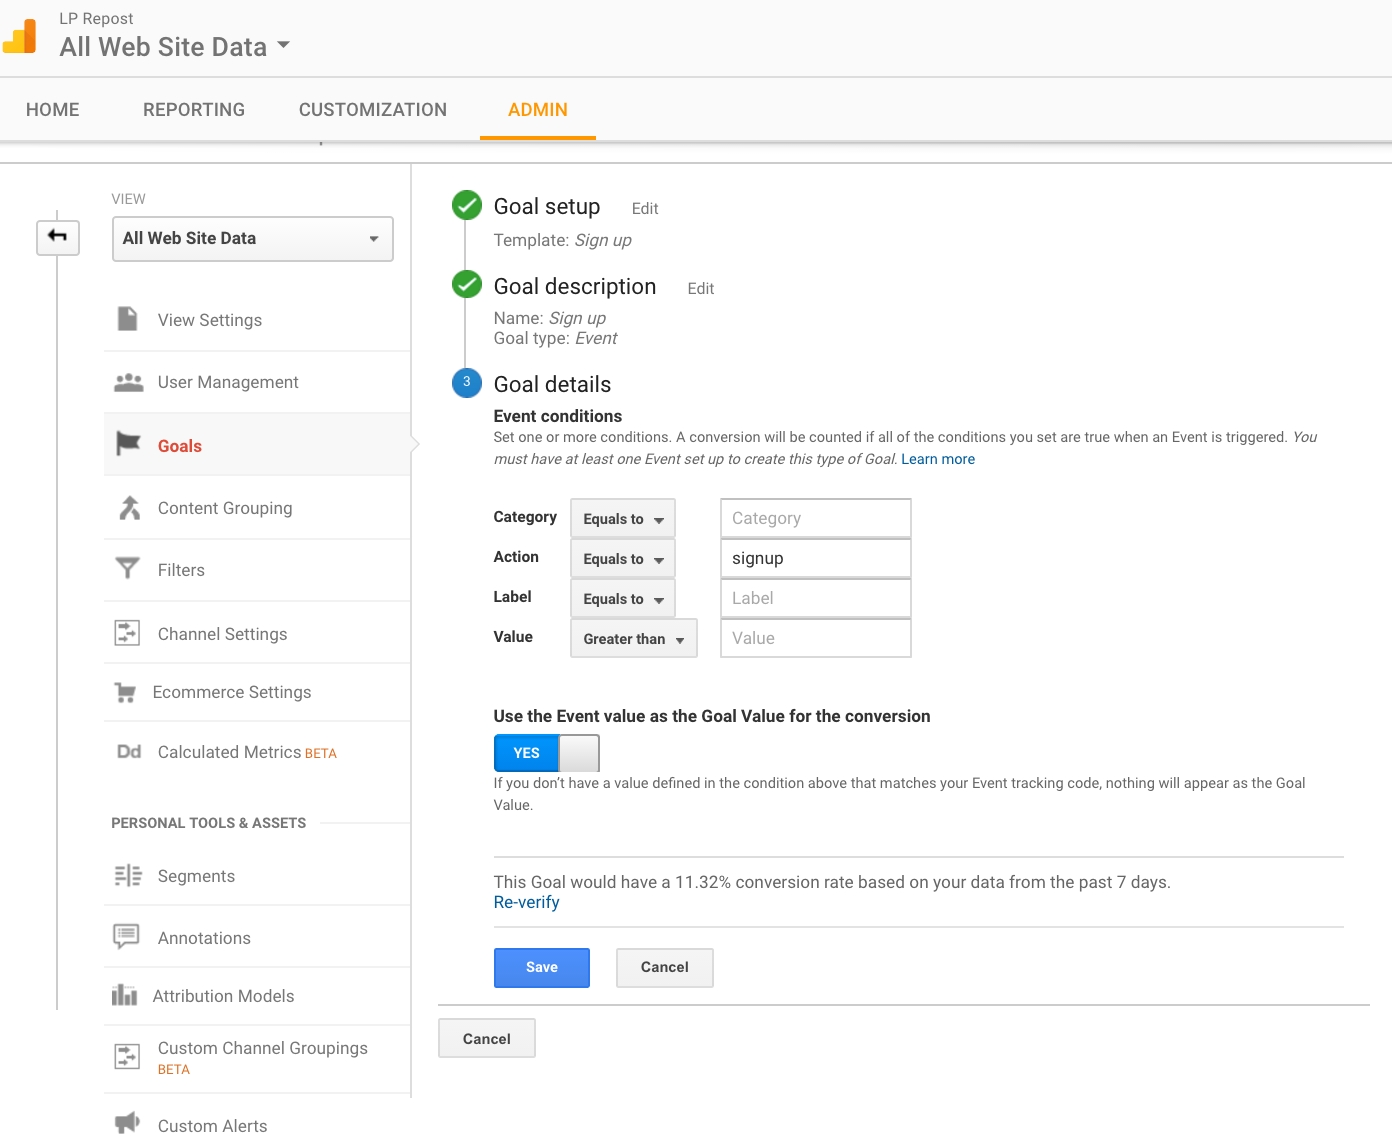
Google Analytics Goal Settings
When you are done with the configuration, if you are using a Destination goal, or if the event you used was already tracked on GA before, be sure to Verify this goal before saving. It should show you the conversion rate based on your last 7 days. If you had no conversion, then obviously the tool might not be able to verify it, so skip this step.
Step 3 : Define an experiment
Get back to the Reporting view and head over the Behavior tab. This section deals with how the visitors interact with your content, and this is where you will find the Experiments tool. This tool is where half of the magic happens (the other half will be on your website, and we’ll describe it in the next section).
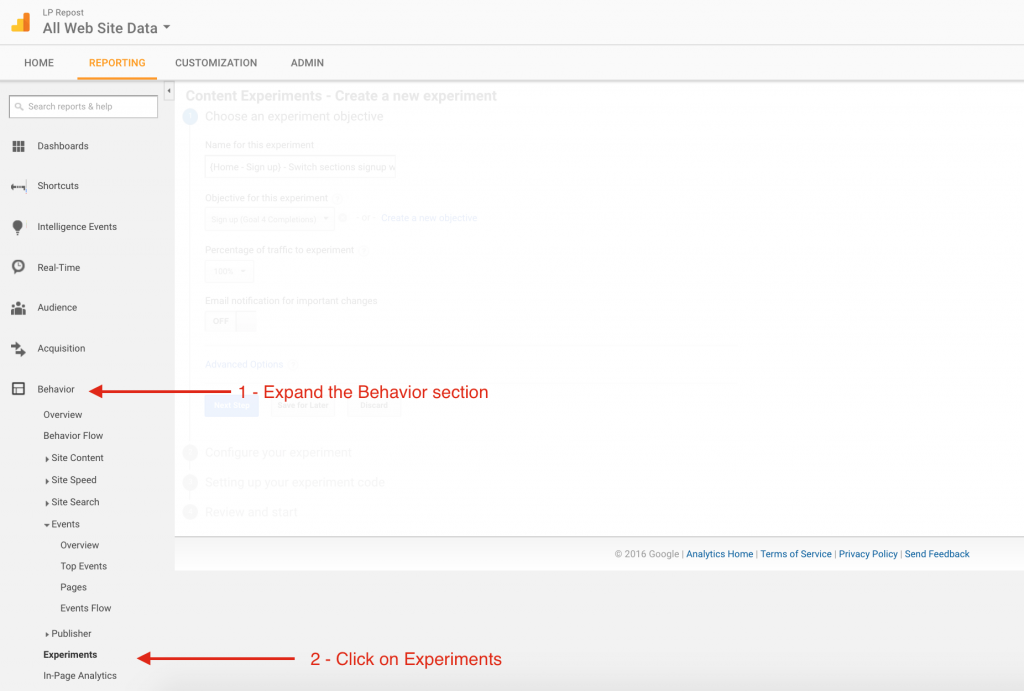
How to access the Google Experiments tool from the current Google Analytics interface
As you will probably be running several experiments over time, I suggest you to have a spreadsheet with all your experiments listed. This will help you to remember what you tested, and what the outcome turned to be.
Basic Settings
Try to use a descriptive Name for each experiments. Remember, don’t run more than one experiment at a time on a given page.
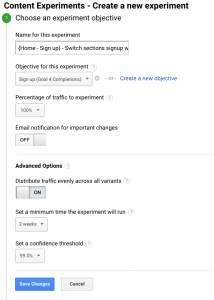
Do you remember of use-case ? We wanted to see the effect on signups if we switched two sections on our homepage. Well, I decided to use the following name for my experiment : {Home – Sign up} – Switch sections signup with testimonials
I have the following naming convention to get things sorted easily : {PageName – Goal} – Experiment description . You are free to use your own naming convention here, but try to be the most explicit possible.
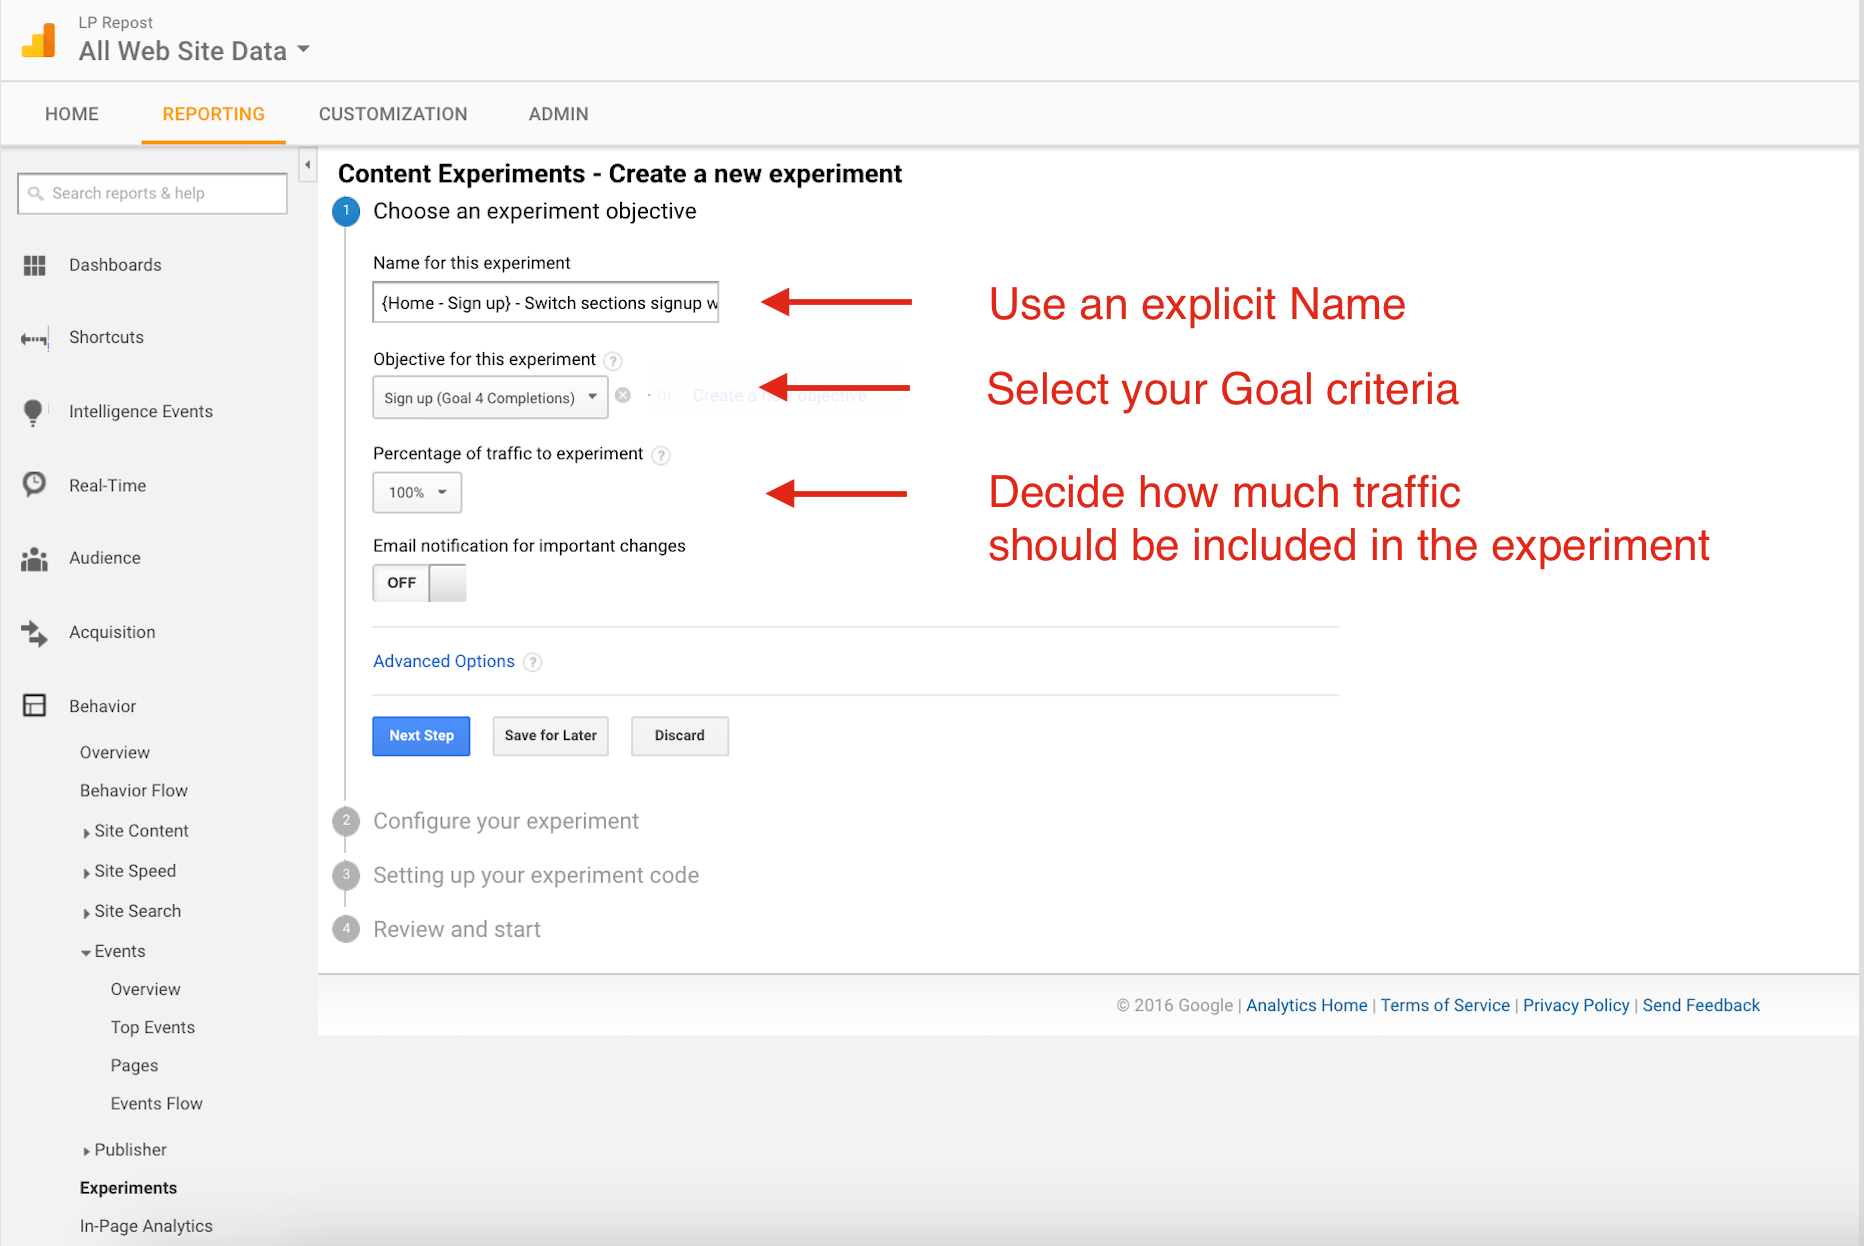
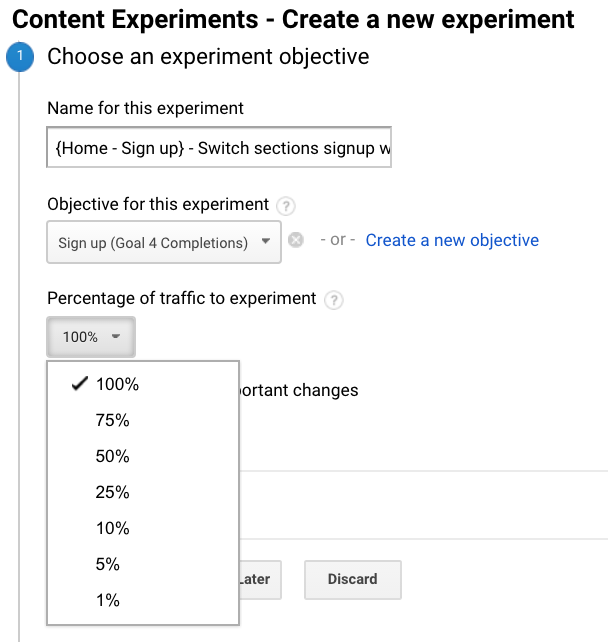
If you have a good amount of traffic, and if your hypothesis is risky, you might not want to impact seriously half of your traffic. This is the reason why you can tune the Percentage of traffic sent to the experiment.
Advanced Settings
You also have some advanced settings, that I suggest to tune a little bit. I am not a data-analyst expert, so I decided to go for the safest settings (and these are not by default) :
First, I don’t want the algorithm to tune the variations traffic to optimize my conversion rate. I am running a real experiment, and want to know the output, I don’t want a self optimized page. So, for that, I turned on the Distribute traffic evenly across all variants switch. If you don’t do so, the winning variation will receive more traffic overtime. This is great for your conversions overall, but you get less feeling about what’s happening in real life.
Then, you can change how long the experiment will run (longer if you have little traffic, shorter if you have tons of it).
And finally, you can adjust the confidence threshold. This is number describe the confidence one can give to an experiment, it’s automatically calculated in Experiments, but you can also do it yourself on isValid.org . The higher the threshold the better. However, keep in mind that a high threshold means that your experiment has to run for a longer time.
The experiment configuration
Well, as we said in the Before you begin section, we will focus on client-side experiments, which involve a javascript code on your website (next section).
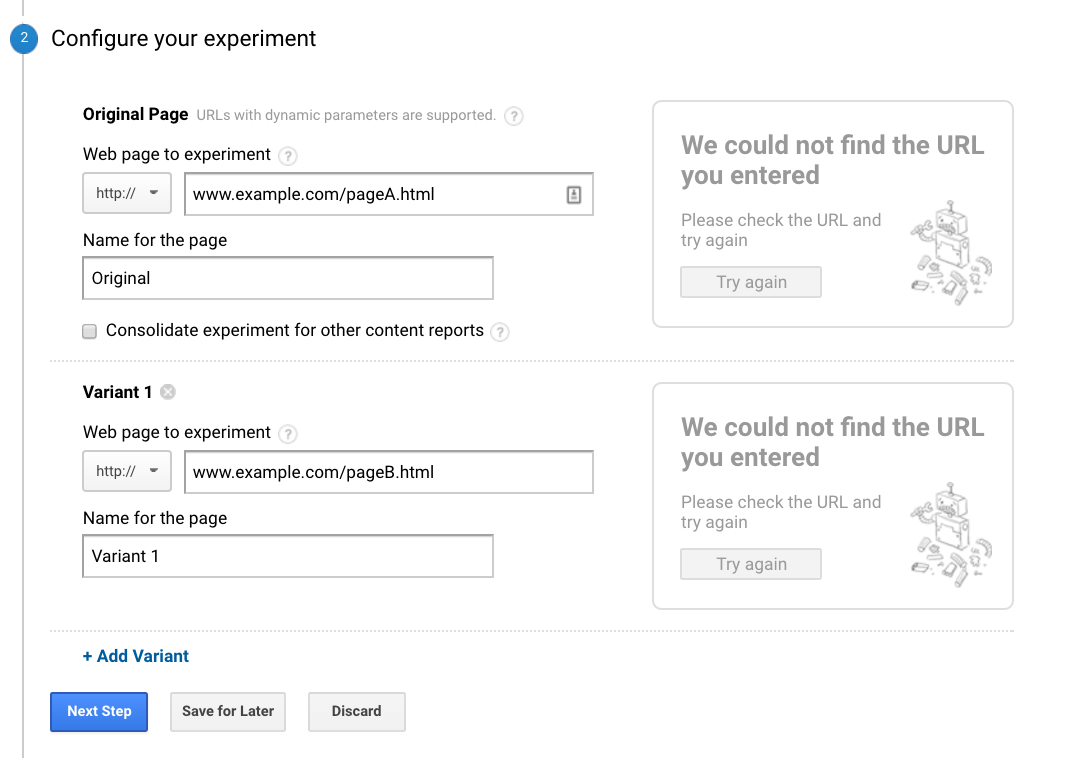
If you want to start easily with your first test and have prepared two pages with different URLs, this is in this where you will add them. Hit next, copy past the long javascript code to use on your page, and you are done, you can start following your experiment.
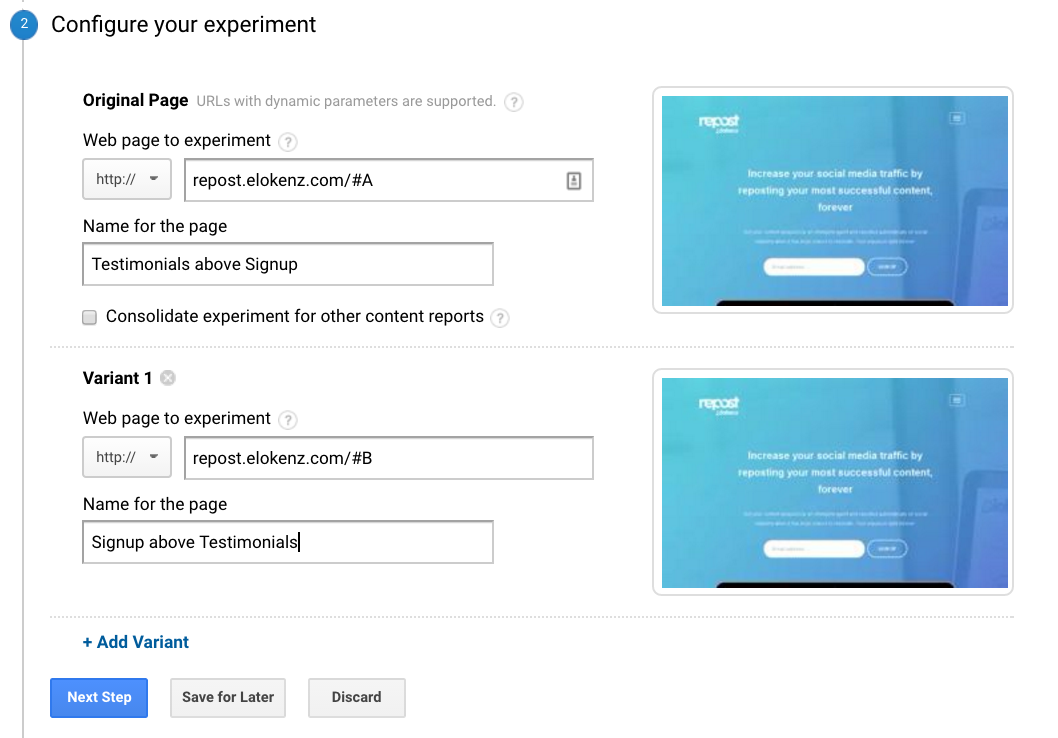
If you want to use the javascript version, this step is not really obvious. You need to enter two distinct URLs , but they are irrelevant for the client-side process. So, what I usually do is to enter the same URL, with two different anchors : www.example.org/#A and www.example.org/#B.
Once again, you have to enter a name, try to use something specific to the experiment. In the context of our experiment, we will set for instance testimonials above signup, and signup above testimonials.
You can add more than 2 variants if you want.
Hit “next”, select the manual insertion of the code on your site. You will need to write down the Experiment ID.
Don’t worry, you can access these data later by coming back to this panel.
Hit save, and ignore the warning message that will pop up.
Step 4 : Website implementation
Now that you have set everything on the side of Google Analytics, you need to prepare your website to display the experiment on the client side. For that part, Javascript will be your companion. I will describe how to use it with JQuery, a library that is widely used (and probably already on your website). If you use a JS framework (Angular, Vue, React, …) then you will probably know how to implement the following all by yourself and change the JQuery commands to fit your needs.
Add the Google script in your head
To instantiate the code, you need to place the following code immediately after the opening <head> of your page. You will need to replaceYOUR_EXPERIMENT_ID with the id you obtained in the previous step (in our case it was FeZ9PTd-TTG124YwOhMiGg).
Now, when a visitor will come to your site, GA will decide what variant should be associated to this visitor for this experiment. What you will do next is to fetch the user’s variant, and to display the page accordingly.
Fetching the visitor variant and tuning the page
Be sure to include Jquery on your page because this is the library we will use to change the layout on our AB tested page. It is important here to have jquery loaded before our script to modify the interface.
Here is the code that changes the layout, I will explain what it does below.
The first line of code is here to inject Jquery (don’t use it if it’s already on your page above this script.
The variable chosenVariation is returned by Google Experiments. It is pretty obvious that it’s the variant that should be associated to the current visitor. This is what we will use to change the appearance of our page.
We define pageVariations an array of functions that should modify our page. Each function is related to a variation. Keep in mind that the order here is important. The first element of this array will correspond to your original version, the second to your first variation (and so on if you have more than one variants).
What you will put in every function is up to you. The first one will likely be an empty function (we return some console message just for debugging purposes) because it’s our original page. In the second one, we use the Jquery insertAfter() to switch the order of our divs. You could also hide() or show() an element, change the content or apply special CSS directives like css({float:”left”}). Jquery has a lot of very useful yet simple commands to adjust your page to the experiment needs.
Step 5 : Test your implementation
If you need to see each variation manually, you change the last javascript line, to specify which variation you want to display : for instance to display the first variant I would change pageVariations[chosenVariation] for pageVariations[1].
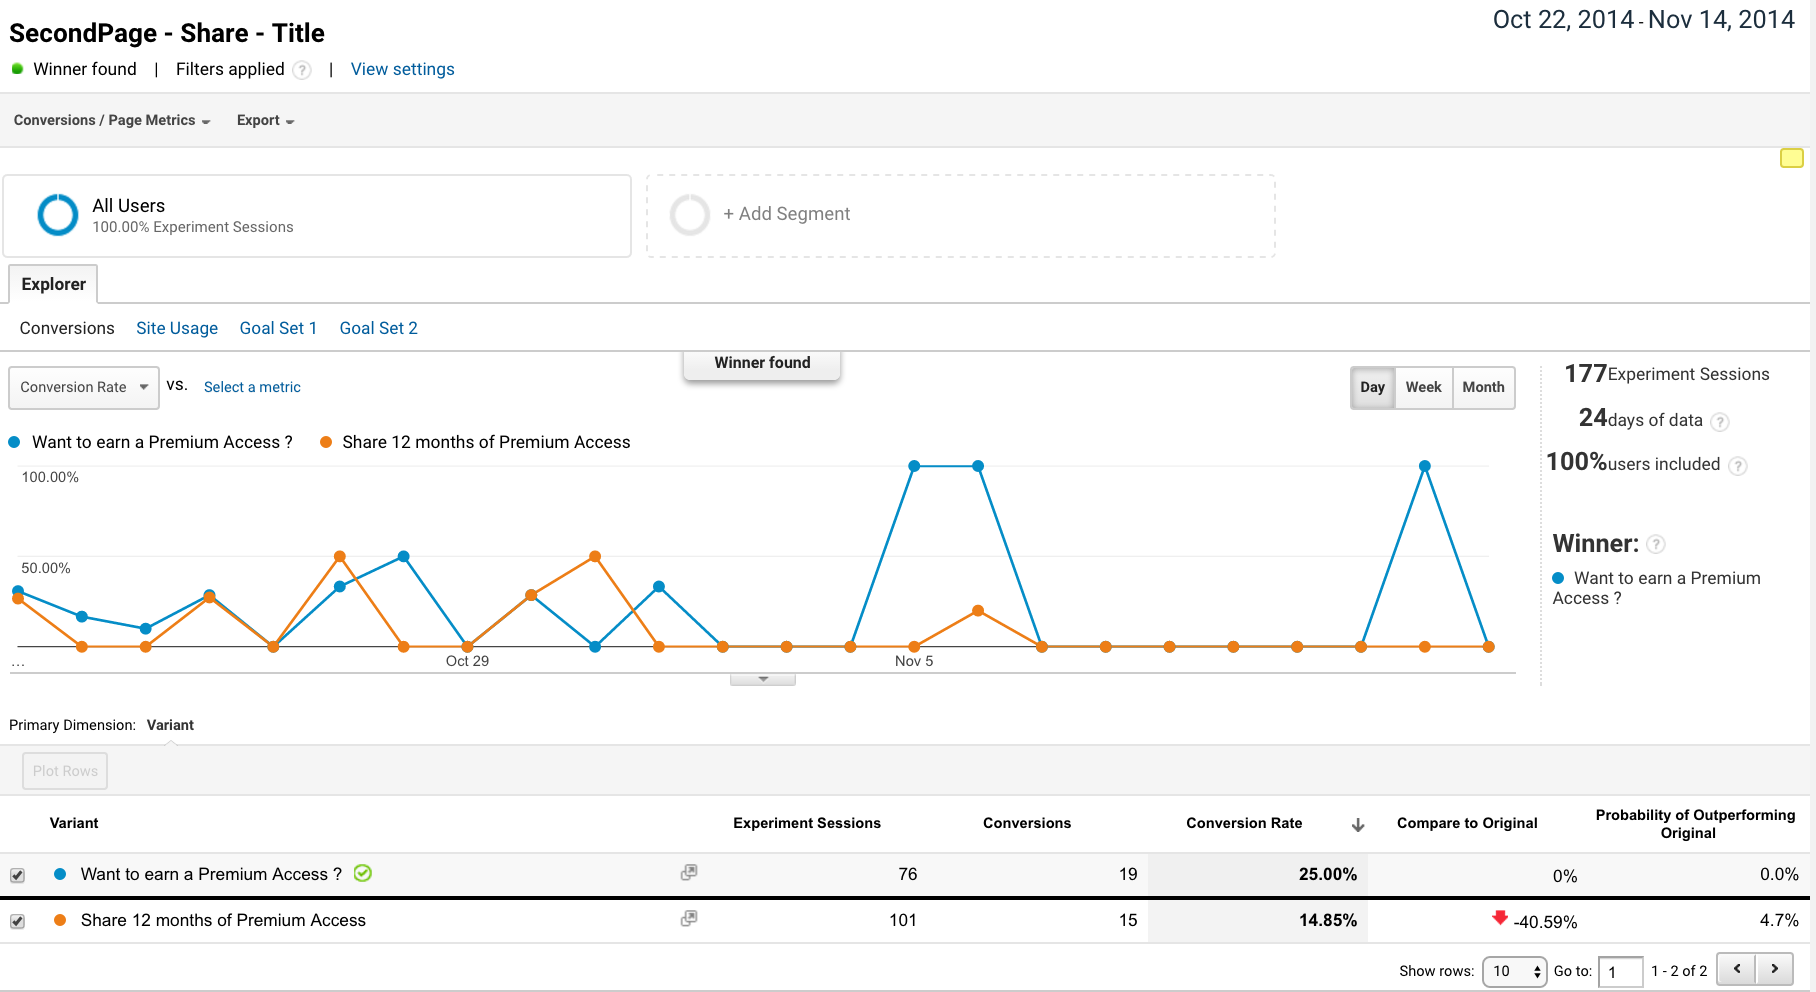
Once everything feels ok for you, publish your page on your server, and wait for some traffic on your page. Soon, you will see some result being displayed on Google Analytics :
Conclusion
If you want to start your journey into data-driven decisions (Pierre Lechelle‘s blog is full with gems), Google Analytics Experiments is a great and cheap companion. Building your first test might be really motivating, but keeping the pace on the long run might require deep cultural change (a nice post from Krista Seiden). Try to find the 4 or 5 important touch point of your online business, and use tests to improve your conversions there.
Have you managed to set up tests in your own organization ? What tool did you use ? Let us know in comment.
While creating this post, I had the occasion to discover a few articles describing how to set up AB tests with Google Tag Manager. Paul Koks and Jules Stuifbergen have written about it here and here. I will probably try to do a recap about this on this blog soon.